
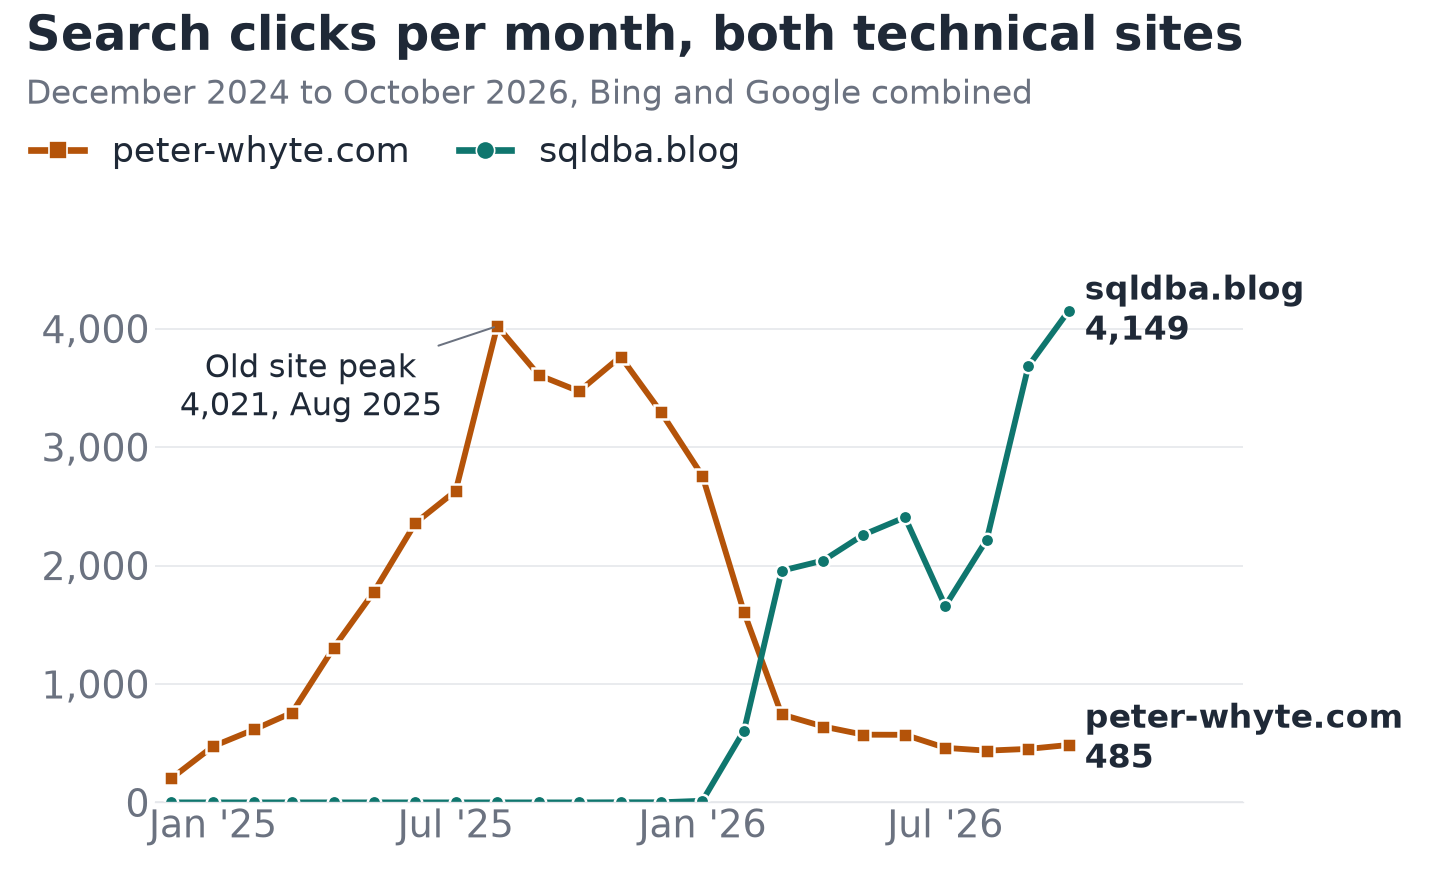
October 2026 was the biggest month I can measure across my two technical sites, 4,634 clicks from search, and 4,149 of them went to sqldba.blog, a site Google was sending one click a month at the end of 2025.
The last one of these I published covered Q1 2025, so this is the catch-up, numbers first, from exports I pulled on 8 November. It covers sqldba.blog and the original peter-whyte.com. I’ve left this personal site’s numbers out, because these updates have always been about the technical side of things.
The short version
October passes the old site’s best month, 4,021 in August 2025, and it’s a better kind of traffic too, because far less of it depends on one page. sqldba.blog has grown to nearly 600 posts this year, built in the evenings with AI agents doing the heavy lifting, and it has almost no backlinks from anywhere else yet. Ads went live on it on 12 August, subtle ones. Bing’s data for it starts in January 2026, so the line starts there.
Two sites, one handover
peter-whyte.com is my original blog, started in 2017. Search took it from about 203 clicks a month in December 2024 to a peak of 4,021 in August 2025, nearly all of it from Bing, and it stayed above 3,000 until the end of that year. At the start of 2026 I began moving the SQL Server content to its own home on sqldba.blog, with redirects, by hand at first. As my use of AI snowballed through the year the work changed completely, and I’ve written about how that works in What Went Into sqldba.blog. The old site’s numbers fell as the new site’s arrived, and by October 2026 it was down to 485 a month.
The peak was never as healthy as it looked. One post, how to download and install SSMS, was 46% of the old site’s Bing clicks in the page report. On sqldba.blog the same subject is 16%, which is the main reason I’m happier with this October than I was with that August.
sqldba.blog, the numbers
| Q2 to Q3 | Q2 | Q3 | Change |
|---|---|---|---|
| Bing clicks | 6,268 | 5,761 | ▼ -8% |
| Google clicks | 441 | 1,800 | ▲ +308% |
| All clicks | 6,709 | 7,561 | ▲ +13% |
| Impressions | 1.07m | 799k | ▼ -25% |
| Click rate | 0.63% | 0.95% | ▲ +51% |
| Google position | 9.4 | 10.7 | ▼ 1.3 |
| Latest month | Sept | Oct | Change |
|---|---|---|---|
| Bing clicks | 2,882 | 3,046 | ▲ +6% |
| Google clicks | 802 | 1,103 | ▲ +38% |
| All clicks | 3,684 | 4,149 | ▲ +13% |
| Impressions | 335k | 298k | ▼ -11% |
| Click rate | 1.10% | 1.39% | ▲ +26% |
| Google position | 9.4 | 9.0 | ▲ 0.5 |
Google position is the average place on the results page, so lower is better. Fewer impressions alongside more clicks looks odd, but the impressions the site lost were most likely the SSMS searches covered below, which rarely turn into clicks.
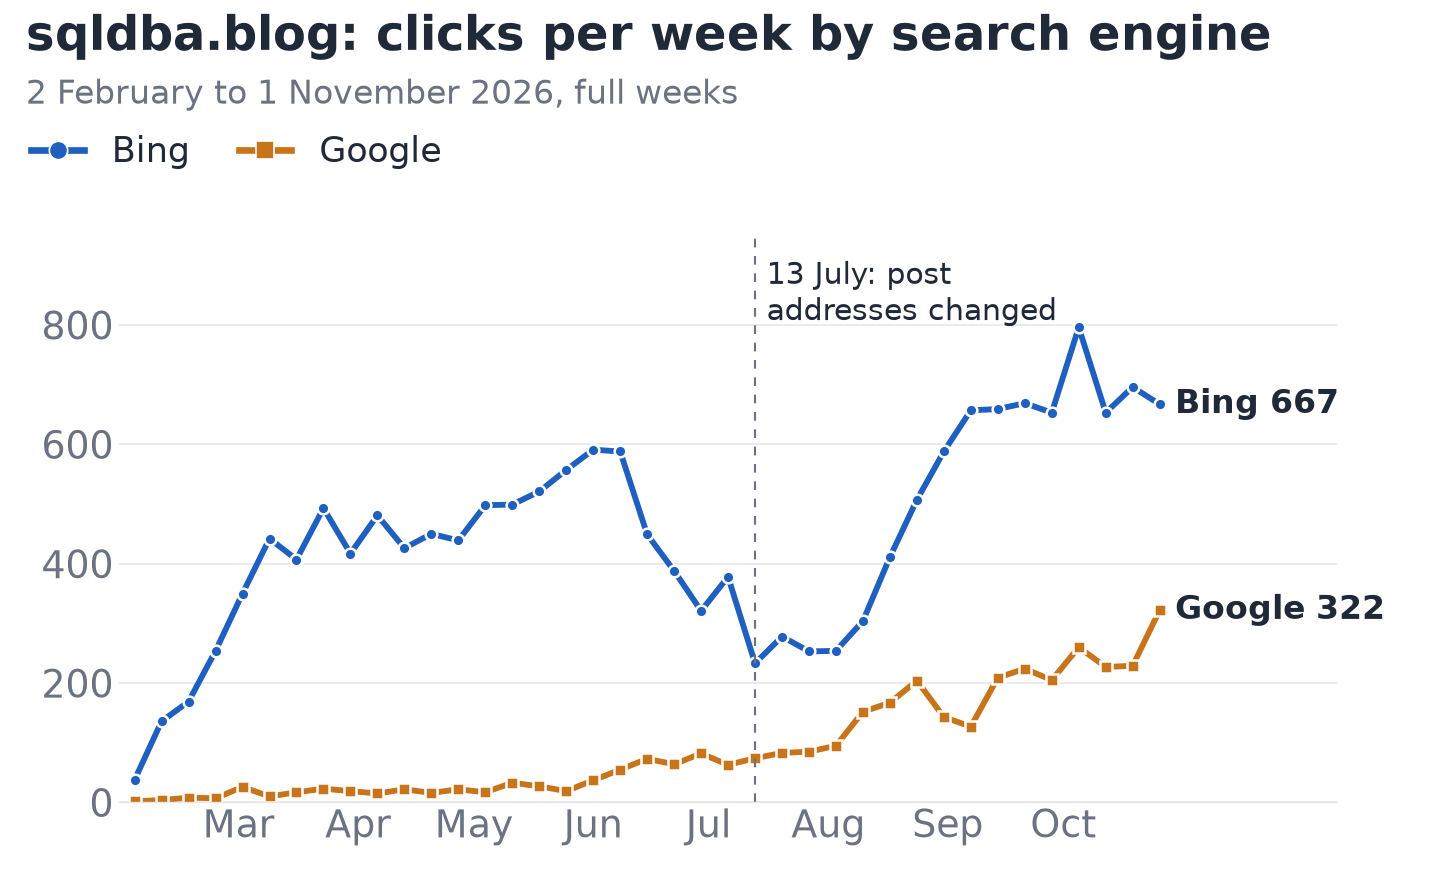
Bing is still the bigger engine, but Google is catching it. Google’s clicks went from 257 in June to 1,103 in October, more than four times as many in four months, and it now brings in 27% of the site’s search clicks.
What the searches really are
Most of what Bing shows the site for is people searching for Microsoft’s own product. In the keyword report, searches containing “SSMS” or “management studio” are 91% of impressions and convert at 0.14%, because those people want microsoft.com. Everything else converts at 1.95%. That’s a sample rather than every click, Bing only reports part of it, but the gap is the point: the rest are reference lookups, builds, sqlcmd and permissions, plus a long tail of error numbers, which is who the site is for.
What the July migration cost
On 13 July I flattened every post address to its name only, so moving a post between categories could never break a link again. It was the right change and it had a price, though the graph makes me less sure how big. Bing was already sliding before it, from 591 clicks a week at the start of June to 321 at the end of the month. It then bottomed out at 233 the week of the change and sat around 250 until mid August. By September it was back above 650 a week, higher than it had ever been, and Google barely noticed. The old site makes me more careful about blaming the change for all of it: its Bing clicks fell by about a third over those same weeks, from 147 to 97, and nothing changed there. Either way, site-wide changes now go one page at a time.
What people read
These are the most viewed pages in Google Analytics over the last 90 days:
That’s mostly practical reference: permissions, build numbers, login errors, ports. It’s 94% desktop on Google, which fits people reading at work. The audience is spread wider than I expected, with the US and UK level at the top:
| Country | Clicks |
|---|---|
| United States | 379 |
| United Kingdom | 378 |
| Germany | 198 |
| India | 148 |
| Netherlands | 98 |
Indexing
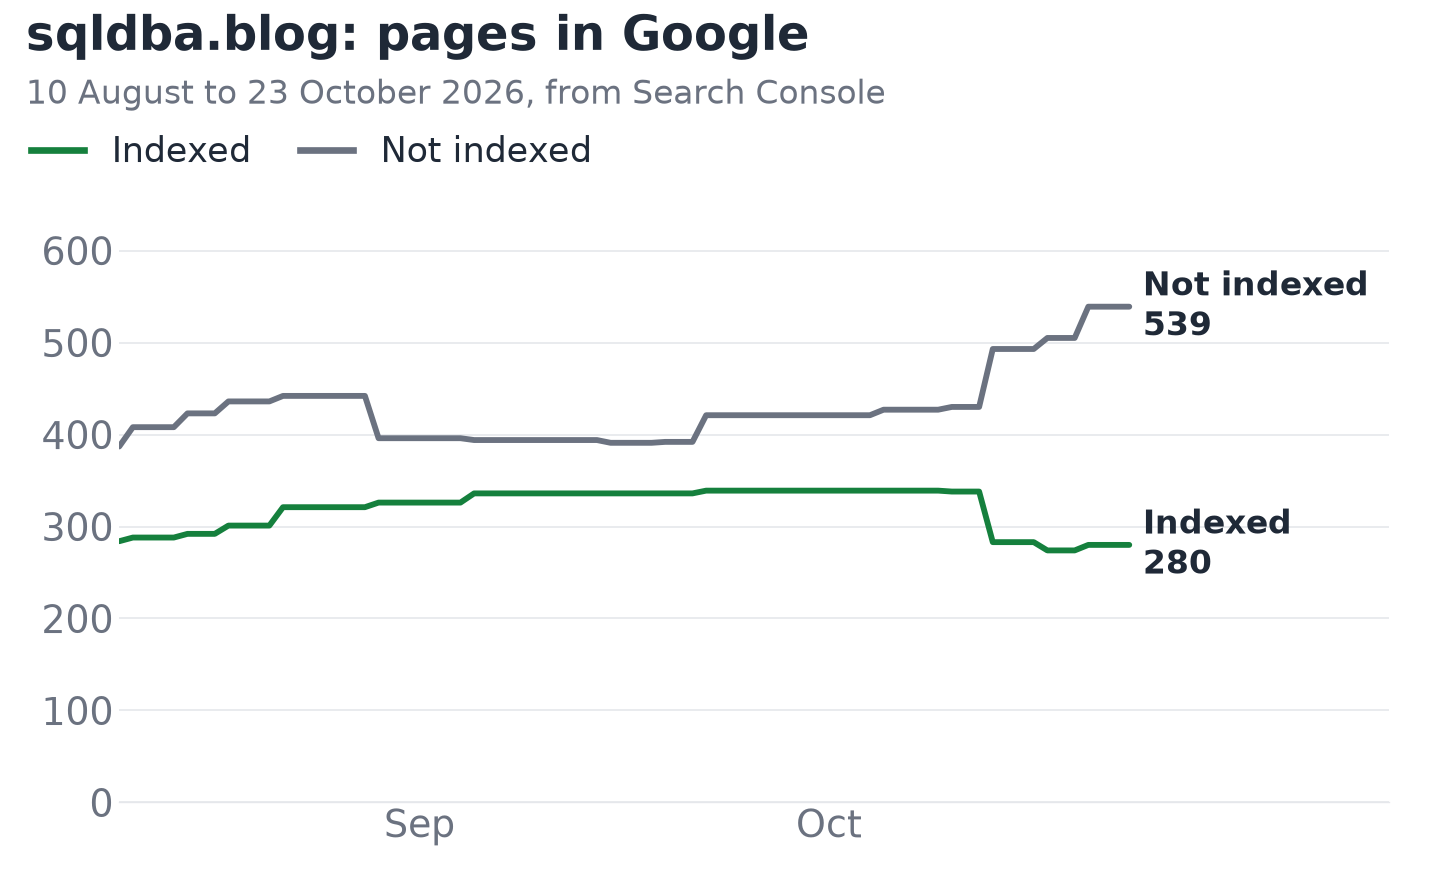
This one is going the wrong way. Google’s indexed count peaked at 339 and had dropped to 280 by 23 October, with 539 pages not indexed. The report doesn’t say which pages dropped out, so I can’t tell you why yet. What I can say is that clicks kept climbing while it happened, so it doesn’t look like the pages earning traffic were the ones that left.
Who visits
| Channel | Sessions | Engaged | Secs each |
|---|---|---|---|
| Direct | 18,719 | 11% | 3 |
| Organic Search | 16,460 | 42% | 31 |
| Referral | 2,115 | 8% | 7 |
| AI Assistant | 86 | 41% | 49 |
Google Analytics covers 10 August to 7 November here, and the top line needs a pinch of salt. Direct is the biggest channel, at about three seconds a session and 11% engaged, which looks like bots rather than readers, and referral looks much the same. Organic search is the real audience, at about 31 seconds. One small thing I’m watching is visits from AI assistants. There were only 86 sessions, far too few to read much into, but they averaged about 49 seconds, the longest of the main channels. My guess is that someone sent to a page by an assistant is already looking for that specific answer.
The old site today
Bing still sends peter-whyte.com about 421 clicks a month. “Restart WSL” is the post that keeps earning, with 1,613 clicks in that same report. From here it’s where my technical writing that isn’t SQL Server goes, so PowerShell, WSL and Windows stay there.
By my memory, at its best it was doing 10,000 to 20,000 users a month, before the ChatGPT-era posts I filled it with from 2023. In August I cleaned a lot of that out, 75 posts, and put 15 back that should have stayed. Google had sent it almost nothing for a year, between 0 and 7 clicks a month from September 2025 to September 2026, and October came in at 64. That’s one month and I won’t read much into it, but it’s the first movement since August, when I cleaned house and wrote the WSL guide.
What’s next
More of the same on sqldba.blog, which means making what already exists better, one post at a time, and new pages only where they tie existing ones together. Links are the real gap, far more than content. And the thing these numbers can’t show is whether any of it earns anything, which is a question for the next one of these.
Leave a Reply